The 2003 Agricultural Census |
|
PREFACE
The National Statistical Office
conducted the Fifth Agricultural Census in 2003 in order to
collect the data on structure of agriculture obtained from the
agricultural holdings throughout the country. The processing
of the large volume of census data will take about 10-12
months. The NSO has thus published this advanced report to
present the census result for some major characteristics based
on one percent sample of agricultural holdings by region and
the whole kingdom. It is expected that this report would serve
the needs of various users before the completion of the final
report which will present the census result from all
agricultural holdings. |
|
|
1.1 Background The National Statistical Office conducted
the First Agricultural Census in 1950, the Second in 1963, the
Third in 1978 and the Fourth in 1993. To obtain timely
statistics of agricultural structure data for policy-making,
monitoring and evaluation of the agricultural development
projects and in accordance with the recommendations of the
Food and Agriculture Organization of the United Nations (FAO),
the Fifth Agricultural Census was thus conducted in 2003.
1.2 Objective The objectives of the Agricultural Census
were as follows:
1. To collect data on
agricultural structures such as number and area of holdings,
land use, land tenure, planted area of crops, number of inland
fishery establishments, water area under fresh water culture,
number of livestock, the use of fertilizer and pesticide,
machinery and equipment, etc.
2. To provide data
for small administrative units.
3. To provide a frame
for other agricultural surveys. 4. To study changes of
agricultural structures in 10 years.
1.3 Coverage The 2003 Agricultural Census covered all
holdings which their agricultural activities were cultivating
crops, rearing livestock and culturing fresh water.
1.4 Data Collection The face to face interview was the
method of date collection for the 2003 Agricultural Census.
The field work was carried out during May 13 to June 10, 2003.
Around 2,500 enumerators were recruited from village health
volunteers and 5,000 supervisors were recruited from local
officer of Department of Agricultural Extension. The
enumerators were sent out to interview all heads of household
using listing form to find out agricultural holders.
Approximately 5.8 million agricultural holders were
interviewed for detailed information using enumeration form
subsequently.
1.5 Definitions
1. Holding A holding
is an economic unit of agricultural production (cultivating
crops, rearing livestock and culturing fresh water) under
single management comprising all livestock kept and all land
used wholly or partly for agricultural production purposes,
without regard to title or legal form. The holding's land may
consist of one or more parcels, located in one or more
separate areas of the same province.
2. Holder A holder
refers to a civil or juridical person who exercises management
control and takes major decisions over the agricultural
holding operation. The holder has technical and economic
responsibility for the holding and may undertake all
responsibilities directly, or delegate responsibilities to a
hired manager. A hired manager participating in economic and
financial responsibilities in addition to managing the holding
is considered a holder.
3. Area of Holding
Area of holding is the combined area of all the holding's
parcels in the province, including land owned by the holder,
rented from others and land under other tenure forms. (Land
owned by the holder but rented to others are
excluded).</dd>
The holding area
includes farmyard, land occupied by farm buildings and
holder's house located on the holding.
4. The Census Day
This refers to May 1, 2003.
2.1 Sample Design
A
Stratified Two - Stage Sampling was adopted for the advanced
report. Regions were constituted strata. The primary and
secondary sampling units were enumeration districts and
holdings respectively.
1) Stratification
Group of provinces in each region were
constituted strata. There were altogether 4 strata, i.e.,
Central, North, Northeast and South .
2) Selection of Primary
Sampling Unit
A
number of sample enumeration districts were selected
systematically in each stratum with a sampling fraction of 1
in 5. The total number of sample enumeration districts was
4,581 from 22,950
3) Selection of Secondary
Sampling Unit
Holdings were ultimate sampling units. Data of every holdings
enumerated with the long form in every sample enumeration
district were proceeded. Then these sample holdings were
selected systematically with a sampling fraction of 1 in 5.
The
overall sampling fraction was 1 in 100 .
2.2 Method of Estimation
The
results were presented separately for region, i.e., Central,
North, Northeast and South .
Let i = 1 , 2 , 3 , … , mh
( serial number of sample enumeration district
)
h = 1 , 2
, 3 , 4 ( region )
1) Estimate of the Total
Number of Characteristic X
1.1
Adjusted estimate of the total number of characteristic X for
the hth region was base on the
formula : |
|
1.2
Adjusted estimate of the total number of characteristic X for
the whole kingdom was base on the formula :

1. Number and Area of Holdings
Based on the 1% sample holdings
of the 2003 Agricultural Census, the total number of holdings
in Thailand was estimated at 5.8 million. The Northeastern
Region occupied the largest number of holdings with 2.6
million (45.6%). It was followed by the Northern, Central and
Southern Region with 23.6, 15.6 and 15.2% respectively.
With the total area of holding
of around 114.5 million rais,1/ or about 35.7% of the total
area of the country.2/ For the regional area, the Northeastern
Region occupied the largest area of holding with 51.9 million
rais (45.4%), followed by the Northern, Central and Southern
Region with 22.1, 19.1 and 13.4% respectively. The average
area per holding of the Whole Kingdom was 19.8 rais, it showed
a gradual decrease from 21 and 20 rais in 1993 and 1998
respectively.3/ The holding in the Central Region had the
largest average area of 24.3 rais, and the smallest average
area was in the Southern Region with 17.3 rais. (Table 1)
|
 |
| 1/ 1 rai = 1,600 square
meters.
2/ Total are of Thailand
320.7 million rais. (Royal Thai Survey Department)
3/ The 1993 Agricultural
Census, the 1998 Intercensal Survey of Agriculture. (National
Statistical Office)
2. Some Characteristics of Holdings
2.1 Holding's Activity and Size
of Total Area of Holding Table 2 indicates that the major
portion (96.4%) of the holding's activity was cultivating
crops, such as cultivating crops only (54.2%), cultivating
crops and rearing livestock (35.4%), etc. Considering the size
of total area of holding, the number of holdings having an
area under 40 rais constituted 88.1%, of which 51.5% were the
holdings with area under 10 - 39 rais, while the largest size
(140 rais and over) had only 0.5%. (Table 2)
|
 |
|
2.2 Land Tenure and Documentary of Right
As regards the land tenure, it
was found that the majority of holdings operated under own
land only (74.0%),14.8% of the holdings operated not only
under own land but also under other land and 11.2% of the
holdings operated under other land. For the documentary of
right, the data show that most of the holdings with own land
had Title deed, NS5, NS3, NS3k (73.6%). (Table 3)
|
 |
| 3. Area of Holding by Land Use and Land
Tenure
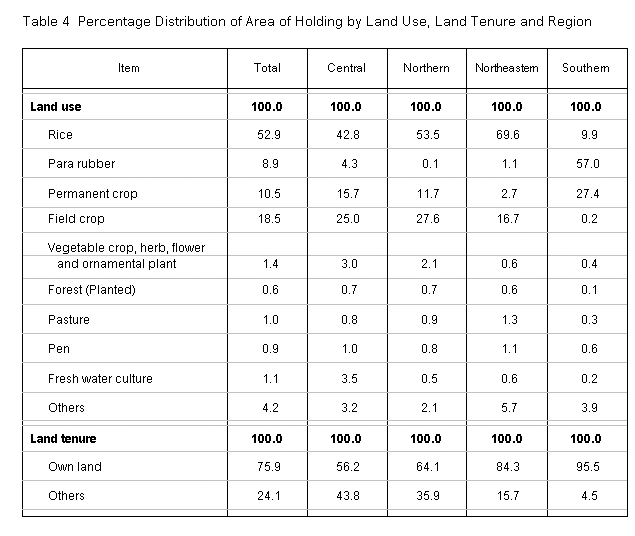
The total area of holding in
the Whole Kingdom was 114.5 million rais. Of these, the major
portion (52.9%) was the area under rice, followed by field
crop (18.5%), permanent crop (10.5%) and para rubber (8.9%)
respectively. According to the distribution by region, the
pattern were almost the same in every region except for the
Southern Region where area under para rubber and permanent
crop occupied most of the land (57.0 and 27.4% respectively).
Considering Land tenure, it was found that the major portion
(75.9%) was the area owned by the holder, of which the area
owned by the holder of the Southern Region was the highest
portion (95.5%). (Table 4)
|
 |
| 4. Fertilizer and Pesticide
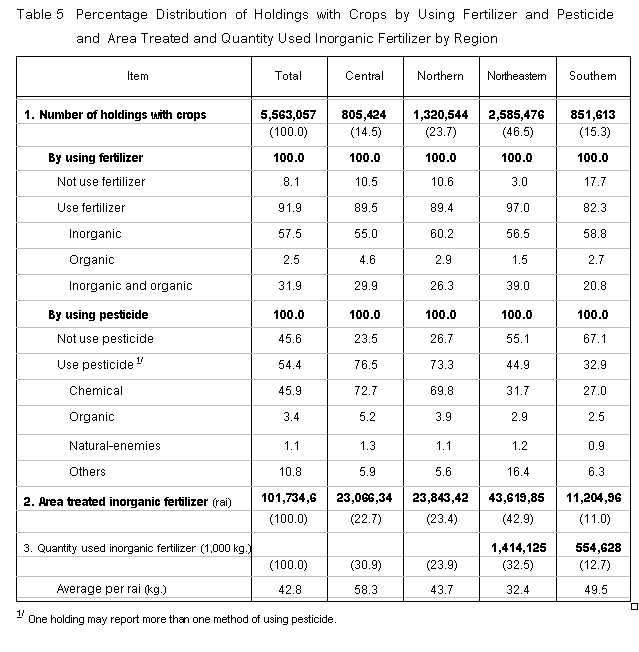
Out of a total 5.6 million
holdings with crops in the country, 91.9% used fertilizers.
Most of them (89.4%) using inorganic fertilizers, of which the
holdings using inorganic fertilizers only was 57.5%, while
31.9% of holdings used inorganic and organic fertilizers.
There was very small number of holdings using only organic
fertilizers (2.5%). It was found that the highest percentage
of holding using fertilizers was in the Northeastern Region
(97%). Among these 95.5% used inorganic fertilizers. The
average inorganic fertilizer per rai of the Central Region was
the highest which was 58.3 kg./rai.
Considering the use of
pesticides, 54.4% of holding reported of using pesticides, of
which 45.9% used chemical. The majority of holdings using
pesticides was in the Central and Northern Region (76.5 and
73.3% respectively), while the holdings in the Northeastern
and Southern Region used pesticides 44.9 and 32.9% only.
(Table 5)
|
|
| 5. Demographic Characteristics and
Activity Status
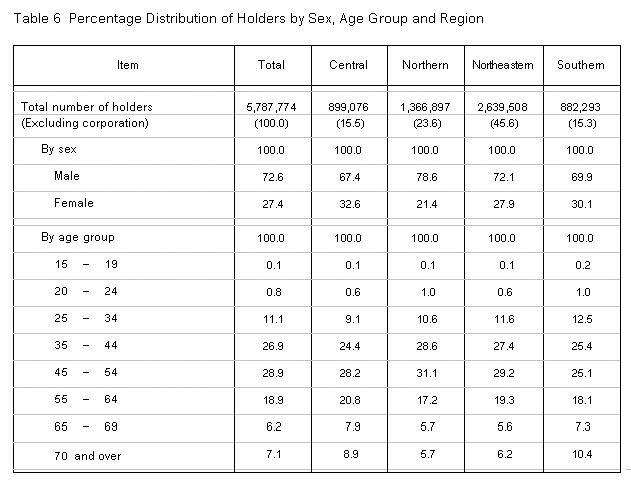
Table 6 indicates that 72.6% of
holders were male and only 27.4% were female. Most of them
(88%) in the age group of 35 years and over. Out of this,
74.7% in the age group 35 - 64 years and 13.3% in the age
group 65 years and over. |
| 
|
|
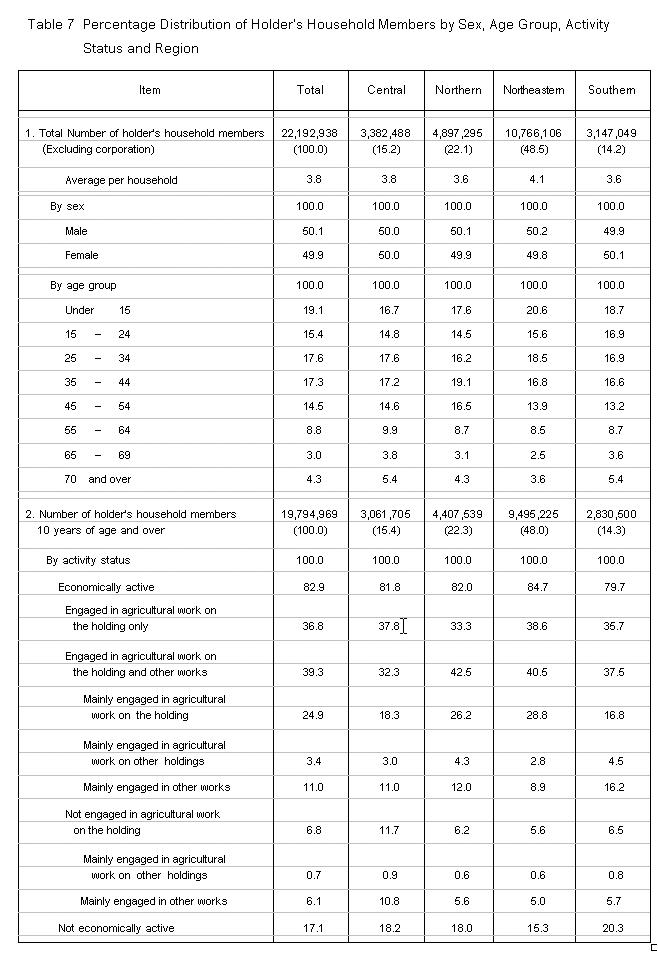
There were 22.2 million
holder's household members or 34.7% of total population, of
which 50.1% were male and 49.9% were female. The average
number of members was 3.8 persons, it was observed a gradual
decrease from 4.3 and 4.1 in 1993 and 1998 respectively. The
dependency ratio2/ was 43.6%.
Regarding the activity status
of holder's household members aged 10 years and over, it was
found that 76.1% engaged in agricultural work on the holding,
among these 36.8% engaged in agricultural work only on the
holding and 39.3% engaged both in agricultural on the holding
and other works. While 6.8% of members did not engage in
agricultural work on the holding. (Table 7) |
| 
|
| 6. Income and Debt of Holder's
Household
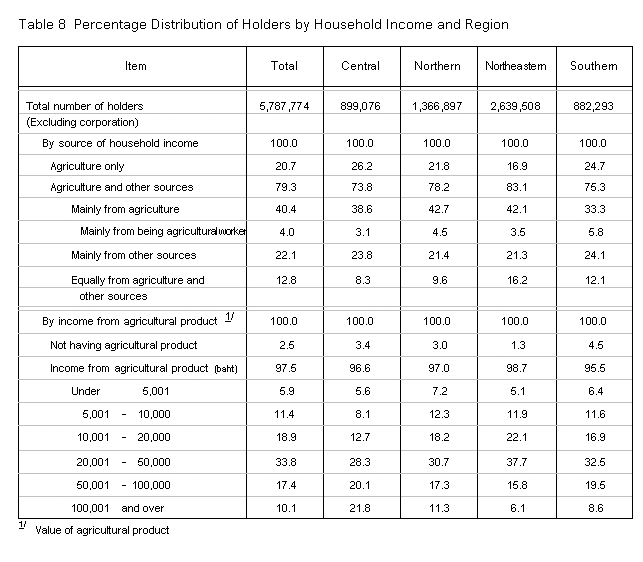
There were 20.7% of holder's
household income from agriculture only, while 79.3% from
agriculture and other sources. This indicates that most of the
holder's household did not rely only on income from
agriculture but also on income from other sources. Regarding
income from agricultural product of holding. It was found that
the holders 33.8% have income from agricultural product in
20,001 - 50,000 baht, followed by income in 10,001 - 20,000
and 50,001 - 100,000 baht with 18.9 and 17.4% respectively,
and 10.1% had income with 100,000 baht and over. (Table 8) |
| 
|
|
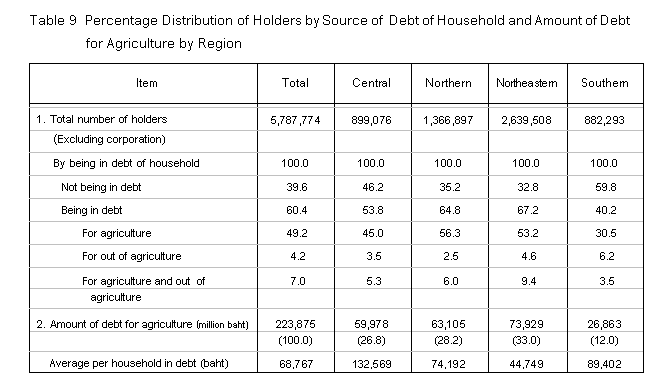
According to debt of household,
there were 60.4% of the holders being in debt, in which 56.2%
were debt for agriculture. Northeastern and Northern Region
had the largest proportion of holders being in debt for
agriculture with 62.6 and 62.3% respectively, while Southern
Region had the least proportion with 34.0%. The amount of debt
for agriculture of the Whole Kingdom was 223,875 million baht.
The average per household in debt was 68,767 baht. The holder
in the Central Region had the largest average debt for
agriculture with 132,569 baht, the least in the Northeastern
Region with 44,749 baht per household in debt. (Table 9) |
|
| 7. Employment on Agricultural
Workers
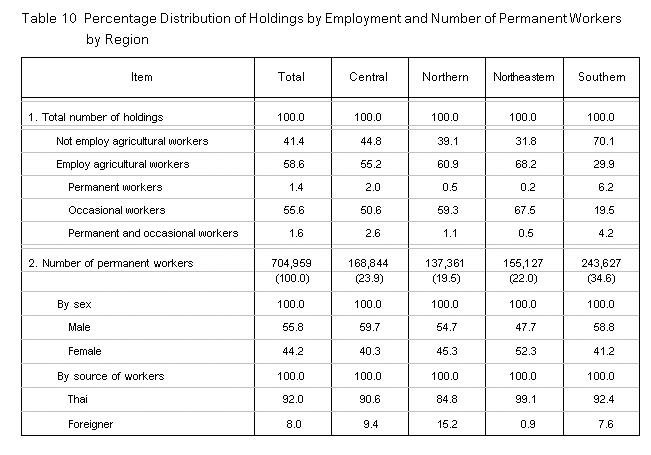
In the Whole Kingdom, there
were 58.6% of the total holdings employed agricultural
workers, of which most of them employed workers on an
occasional basis. The data show that only 3% of the total
holdings employed permanent agricultural workers with 704,959
persons, among these 8% were the foreigner workers. (Table 10) |
| 
|
|
|